Clustering Pitchers By Similarity: Part 2
In my last post, I discussed one of my latest research projects, clustering pitchers by their similarities. The problem I’m trying to address with the analysis is to come up with an alternative to what is possibly the overall worst use of quantitative analysis in baseball–evaluating batter-pitcher match ups, based on career historical performance data between one batter and one pitcher. Instead, I’m trying to identify groups of pitchers that are likely to induce similar offensive performance by a single batter. If we can find a cluster of pitchers who present a similar challenge to a hitter, then we can enlarge the sample size of batter-pitcher “results” and at the same time shorten the timeframe over which we are measuring performance. For example, against right-handed hitters, my analysis suggests that lefty pitchers Barry Zito, Mark Buehrle, Paul Maholm, Zach Duke, Chris Narveson, Eric Stults, Joe Saunders and Jason Vargas (among others) are “similar”. This similarity is based on the profiling factors listed in the previous post, including the pitch repertoire, release points, most common 2-pitch sequences, the portion of the strike zone the pitcher favors, etc.
Below is a visual mapping of pitcher clusters. Each node represents a pitcher and each line between pitchers represents a “connection” or a similarity, based on a defined minimum threshold level. This graph includes only LHPs and it clusters them against only right-handed hitters.
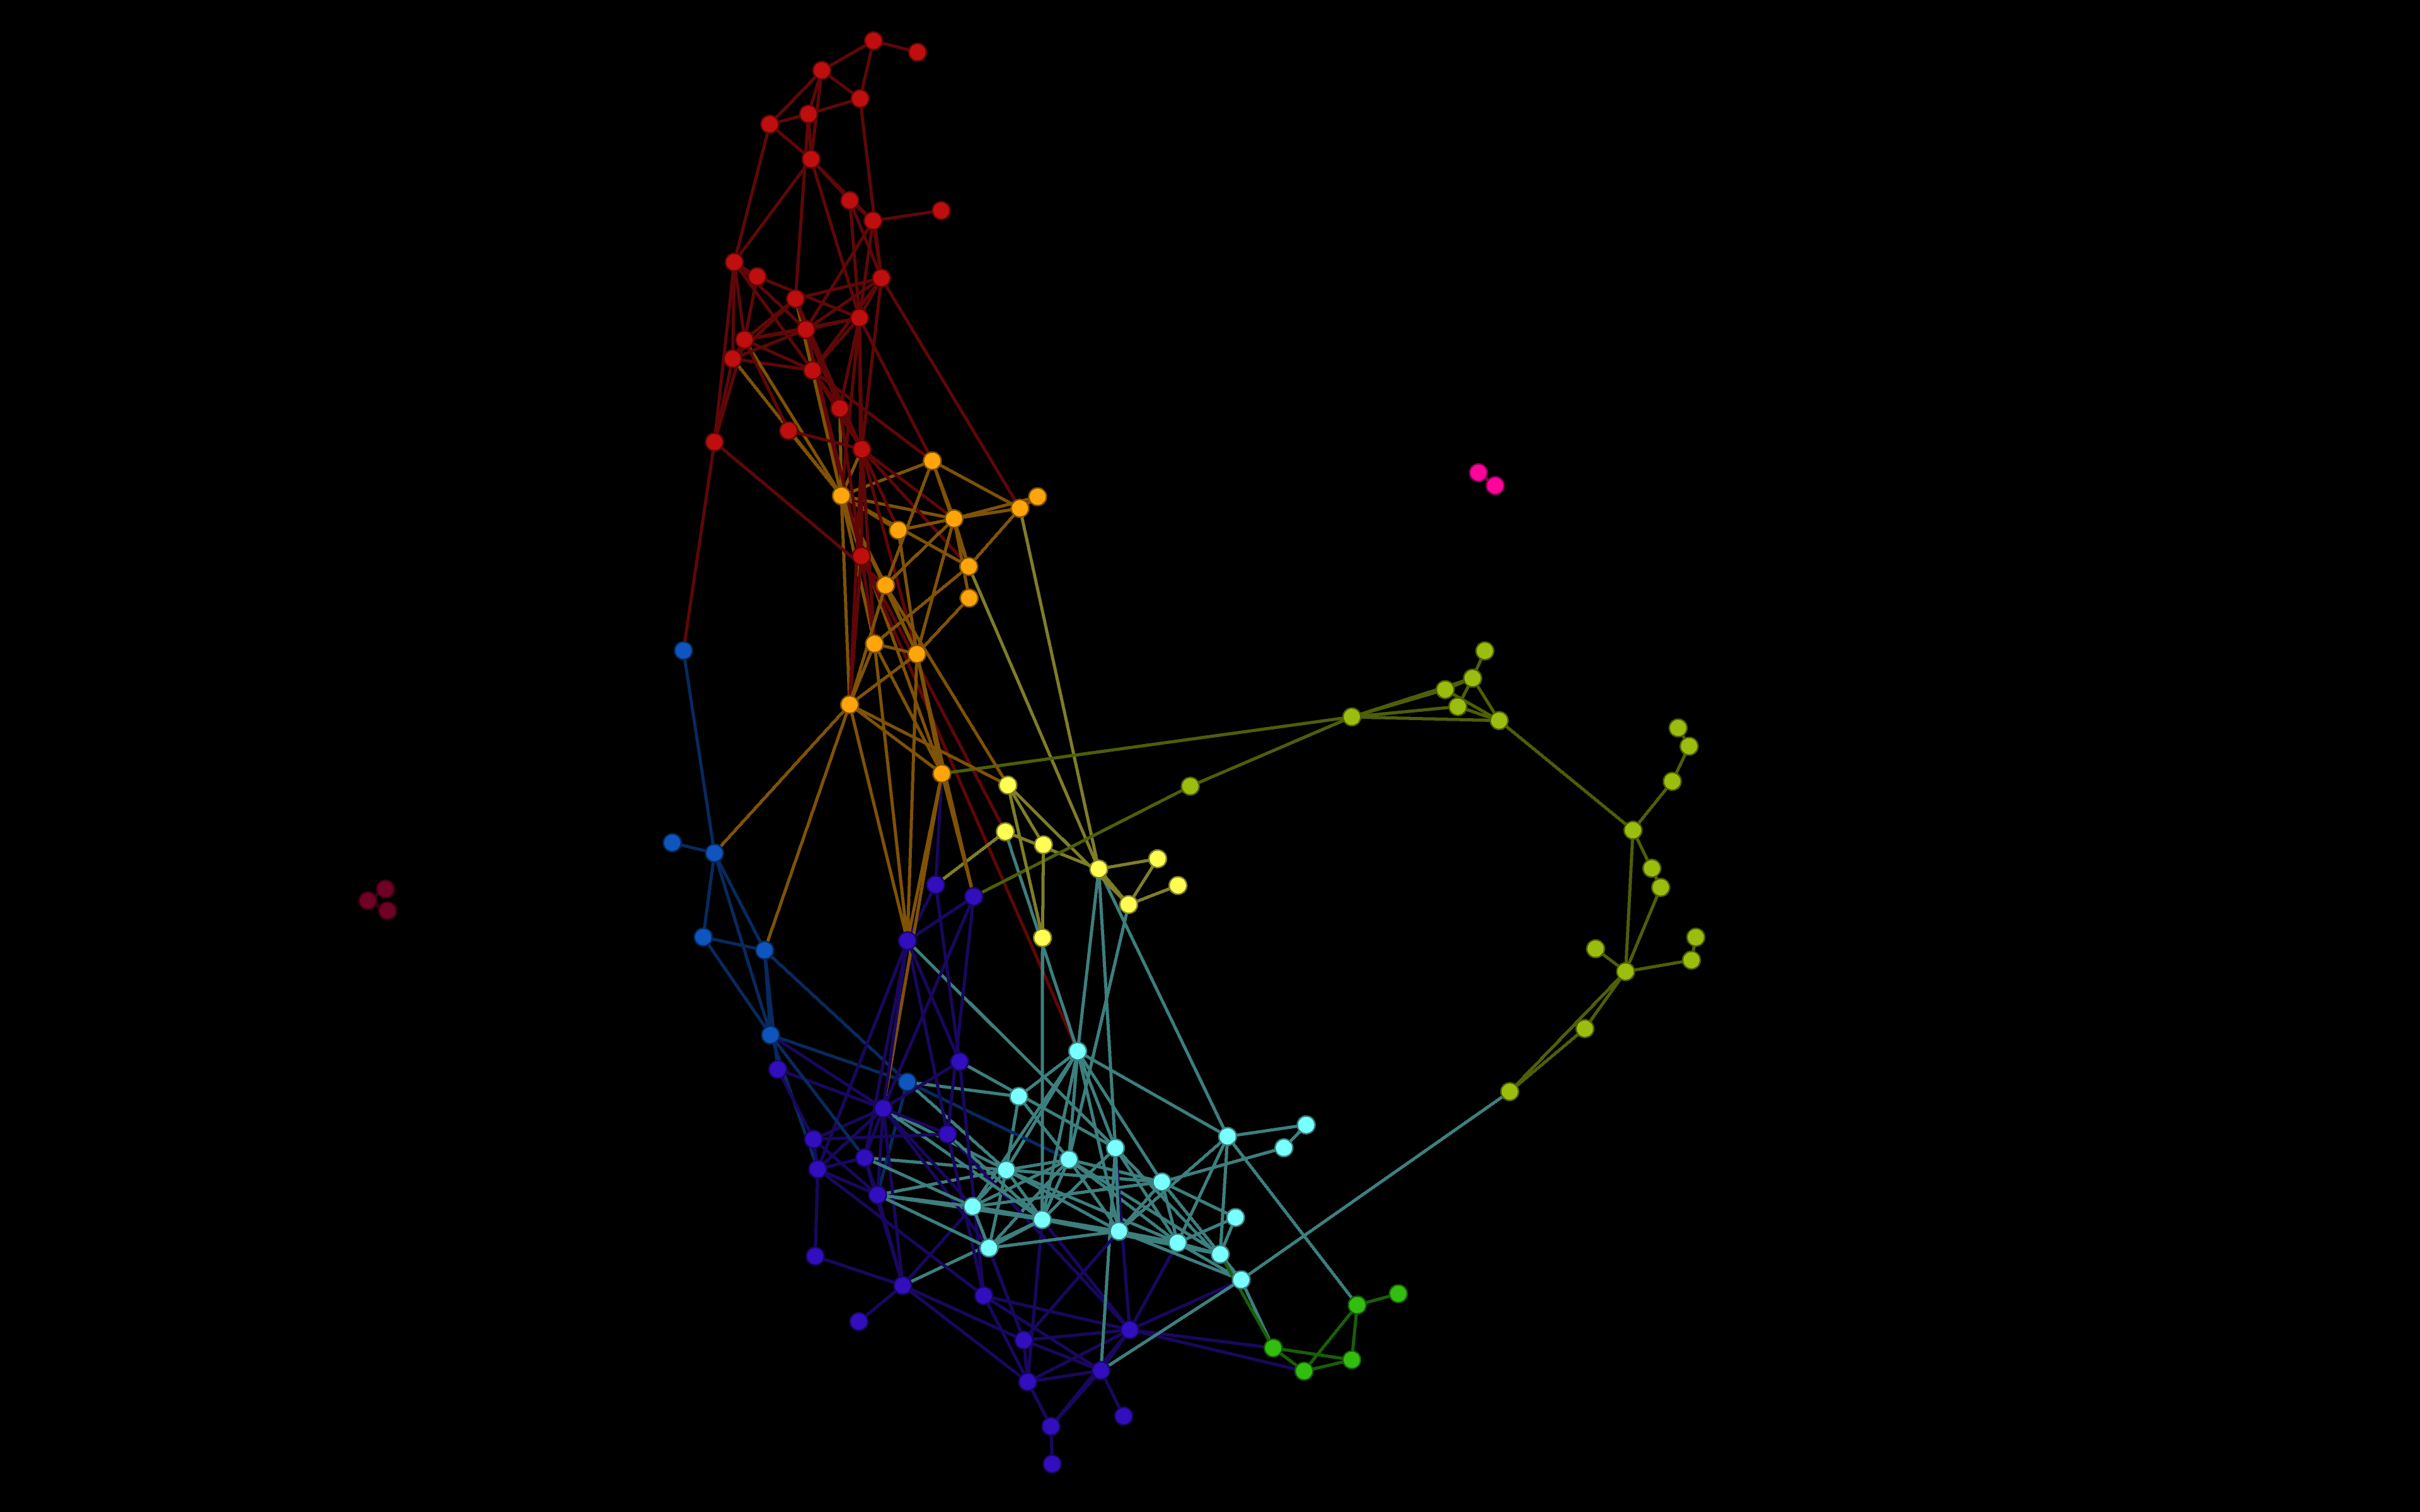
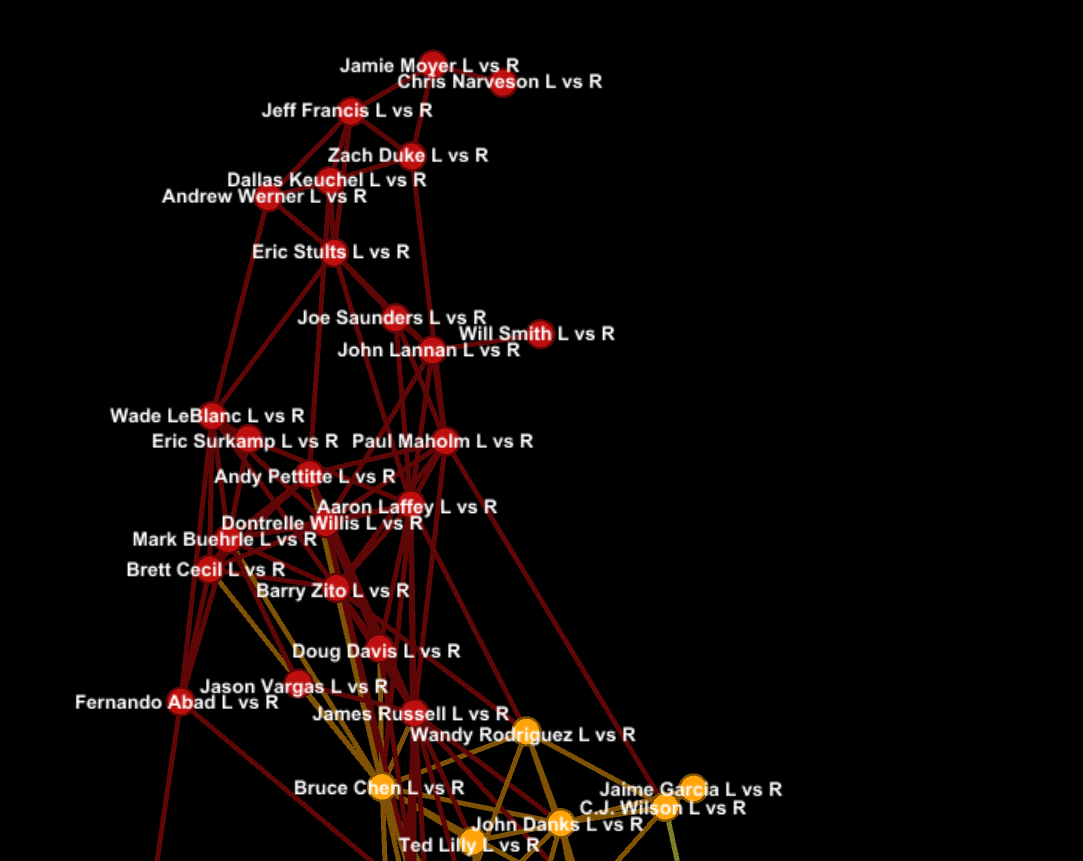
Take note of the large cluster in red, at the top of the graph. Below is a zoomed version with labels identifying the pitchers. This is the cluster I reference above, which includes Zito, Buehrle, et. al.
Let’s take a deeper look at an example of Matt Holliday against this particular cluster of LHP. Over his career, Matt Holliday is 2 for 14 (in 17 plate appearances) against Joe Saunders. However, my analysis shows that Holliday crushes this cluster of LHP’s with an OPS in the 85th percentile against this cluster. So which is it–does the Holliday-Saunders match up favor Saunders, as the one-on-one career data suggests, or does it favor Holliday, as my analysis suggests? I don’t have a definitive answer (although I do have a test in mind, which I may conduct and write about at a later time), but I can make the case. Of the 17 PAs Holliday has had against Saunders, nine of them occurred four years ago in 2009, with just 8 PAs occurring in the last two seasons. By contrast, Holliday had 82 PAs against Saunders’ cluster of “like” pitchers over the same two-year period–2011 and 2012. I like the recent experience of two years vs. a career and I like the sample size of 82 vs. 17. I hope to have further comments on the value and predictive power of the pitcher cluster analysis approach in the coming weeks.

I checked the Holliday – Saunders matchup. Holliday lined out to second once; had that been a hit his BA would be .214. Of Holliday’s two hits one was a homer in 2012.
Have you categorized batters in a similar manner? If so, have you matched various patterns: pitchers v. batters. My instinct tells me that both pitchers and batters have slots for throwing and swinging and that there’s not much either can do about it. If slots coincide, good for the batter. If not, good for the pitcher.